


Running a regular AI visibility audit has become the core operational benchmark for enterprise market evaluation. Your standard web analytics accounts might show steady keyword index performance, yet your overall conversion volume continues to contract. Traditional tracking metrics fail to reveal where these missing user journeys are going because conventional attribution dashboards cannot trace interaction metrics within closed conversational ecosystems.
The structural gap is significant: conversational interfaces now influence hundreds of millions of user queries every day. In roughly 60% of those consumer research paths, buyers resolve their intent without ever accessing a third-party domain. If your digital properties are not explicitly pulled as primary sources within these dynamically compiled summaries, your business is effectively invisible to an entire generation of high-intent buyers.
With active Gartner research showing a permanent 25% drop in traditional mobile and desktop search query actions, establishing a framework to evaluate your brand data layer has become critical to safeguarding market acquisition tracks.
If your team is new to analyzing conversational footprints, we suggest reviewing our core resources comparing generative engine optimization versus classic SEO systems along with our commercial impact study on adapting enterprise content for AI models.
The underlying operational breakdown is rarely caused by content quality issues. Rather, it stems from data architecture friction that prevents automated models from verifying your brand nodes. Most organizations discover this hidden suppression by accident—typically after quarters of unexplained lead drops and unproductive channel post-mortems. By that phase, agile competitors have already established dominant citation nodes across major knowledge graphs, shifting buyer trust away from legacy market leaders.
This operational framework outlines a direct, fifteen-minute evaluation blueprint to precisely map your active multi-model share of voice and calculate the exact pipeline revenue going to competitors.
? Table of Contents
- Part 1: The 5-Minute Structural Visibility Evaluation
- Part 2: Quantifying Missing Inbound Revenue
- Part 3: Isolating the Root Causes of Model Suppression
- Part 4: Defining a Full Enterprise Inbound Audit
- Part 5: Immediate Technical Action Roadmap
- How Fastgrowing.ai Modifies Model Visibility
- Frequently Asked Questions (FAQ)
- Secure Your Specialized Brand Visibility Evaluation
Part 1: The 5-Minute Structural Visibility Evaluation
Before executing advanced pipeline math, you must determine whether primary machine learning models can access your foundational brand attributes.
Phase 1: OpenAI Ecosystem Evaluation
Submit these three precise contextual queries directly into ChatGPT to test basic retrieval capability:
- “Provide an operational breakdown of [Your Company Name]’s core offerings.”
- “Identify the leading corporate platforms providing [your specific market category] services.”
- “Provide a direct structural comparison between [Your Company Name] and [Primary Competitor Name].”
Phase 2: Perplexity Real-Time Index Evaluation
Perplexity updates its index models continuously and provides direct citation link attribution. Submit these prompt paths:
- “What is the market positioning of [Your Company Name]?”
- “What are the top enterprise options for [your category] mapped to [specific use case]?”
- “Analyze [Your Company Name] versus [Competitor Name] regarding integration capabilities.”
Phase 3: Google Gemini Framework Evaluation
Google’s multi-modal framework prioritizes distinct enterprise knowledge bases. Run these checks:
- “Who are the recommended [your category] providers for corporate deployment?”
- “Evaluate if [Your Company Name] is structurally suited to handle [target operation problem].”
The Baseline Metric Matrix:
| Total Confirmed Brand Recommendations | Organizational Operational Status |
|---|---|
| 0-1 Positive Identifications | Systemic Omission — Your brand data is ignored during model synthesis. |
| 2-4 Positive Identifications | Fragmented Footprint — Brand attributes appear inconsistently across models. |
| 5+ Positive Identifications | Active Inclusion — Models reliably recognize your organizational footprint. |
Benchmark data shows that roughly 44% of B2B SaaS organizations fail basic inclusion tests. If your business sits inside the fragmented or omitted classifications, your inbound lead channels are directly exposed while competitors with clean data layouts secure top placement.
To analyze why standard keyword tracking no longer insulates client acquisition loops, read our specialized data overview on the zero-click search pipeline shift.
? Free AI Visibility Audit — Does AI See Your Brand?
Take the 5-minute AI visibility check to discover if AI knows your brand exists. This infographic walks you through the three-step audit process — asking ChatGPT, Perplexity, and Gemini key questions about your business, category, and competitors. It then provides a reality check matrix showing where you stand (Invisible, Partial Visibility, or Visible) and reveals the hard data: 44% of B2B SaaS companies score below 50 in AI visibility. A must-see resource for any brand that wants to stop guessing and get real data on their AI visibility before competitors capture the AI-native audience.
? Click the image to enlarge or download it for quick reference.
Part 2: Quantifying Missing Inbound Revenue
Most basic tracking metrics fail to map the true fiscal impact of model invisibility, ignoring the explicit pipeline value diverted by native platform resolution.
Step 1: Map Unbranded Traffic Foundations
Access your main tracking console and log total impressions and click actions across your top twenty non-branded commercial terms.
Step 2: Isolate the Zero-Click Resolution Factor
While cross-engine metrics settle around a 60% zero-click baseline, interaction variances shift depending on specific intent parameters:
| User Search Intent | Native Interface Resolution Rate |
|---|---|
| Informational Journeys (“how to resolve operational error”) | 75-85% |
| Commercial Comparisons (“best enterprise software alternatives”) | 45-55% |
| Transactional Steps (“licensing tier cost structures”) | 25-35% |
Step 3: Measure AI Referral Capture Potential
Brands that optimize to achieve a 30%+ share of voice inside conversational summaries successfully capture up to 80% of native referral pathways:
| Your Cross-Model Share of Voice (SOV) | Available Referral Pipeline Capture |
|---|---|
| 0-10% (Suppressed Baseline) | 5-10% of gross available volume |
| 10-25% (Emerging Footprint) | 15-25% of gross available volume |
| 25-40% (Established Authority) | 40-60% of gross available volume |
| 40%+ (Market Dominance) | 70-85% of gross available volume |
Step 4: Calculate Missing Session Metrics
Use this formula to define diverted sessions:
Diverted Volume = (Gross Organic Access Loops × Zero-Click Parameter) × (1 – Active SOV Capture Percentage)
Step 5: Define Pipeline Conversion Values
Pre-educated users arriving via target model references demonstrate conversion rates between 12% and 14%—nearly five times the conversion efficiency of standard organic traffic loops.
Step 6: Map Total Revenue Deviations
Pipeline Value Lost = Diverted Volume × Model Conversion Rate × Close Efficiency × Average Contract Value
Standard Enterprise Pipeline Analysis:
- Baseline Monthly Organic Inbound Traffic: 10,000 sessions
- Diverted Interface Resolution Parameter: 5,000 missing sessions
- Current Cross-Model Share of Voice (5% Baseline): Siphoning only 350 active sessions
- Diverted Inbound Opportunities: 4,650 sessions/month
- Model Conversion Efficiency: 10%
- Diverted Enterprise Leads: 465 leads/month
- Average Sales Close Efficiency: 20% | Target Contract Values: $5,000
- Estimated Monthly Pipeline Deviation: 465 × 0.2 × $5,000 = $465,000 in monthly value
This projection maps real enterprise customer volume currently channeled toward optimization-forward competitors who actively manage their conversational search assets.
Part 3: Isolating the Root Causes of Model Suppression
If your diagnostic checklist indicates fragmented or omitted visibility, your content architecture is likely experiencing specific data mismatches:
Root Cause 1: Fragmented Entity Resolution
Large language models require perfectly unified descriptors to verify your business across external data sets. Inconsistencies between your corporate domain text, directory profiles, and executive networking profiles cause models to lower your data trust scores.
Resolution: Cleanse and align your corporate profiles across all primary databases.
Root Cause 2: Absent or Outdated Structured Scripting
Integrating comprehensive microdata schemas directly into your core code acts as an explicit translation layer for machine parsers. Validated datasets show extraction rates moving from 16% up to 54% when clear backend definitions are active.
Resolution: Deploy flawless Organization, Product, and FAQ schema layers across your domain layout.
Root Cause 3: Depressed Contextual Mention Frequencies
AI models prioritize multi-platform validation to confirm category prominence. If your brand is completely missing from heavily crawled third-party discussion hubs, your authority signals will flatten.
Resolution: Move your acquisition strategy toward generating active third-party citations over simple backlink count. For execution blueprints, read our optimization manual covering maximizing citation velocity inside authoritative forum spaces.
Root Cause 4: Narrative Text Structuring Barriers
Over 70% of citations across modern models pull directly from highly structured Answer Capsules. Long, narrative prose that lacks clear structural milestones prevents machine models from reliably parsing out quick answers.
Resolution: Re-architect key informative pages into direct question-and-answer pairs. For explicit steps, read our framework on optimizing corporate content assets for direct AI model synthesis.
Root Cause 5: Semantic Content Decay
Content assets left un-refreshed for longer than 13 weeks show sharp drops in active model citations as algorithms prioritize fresh data points.
Resolution: Put core informational assets on a routine content refresh cycle.
Part 4: Defining a Full Enterprise Inbound Audit
While an initial 5-minute check acts as an early indicator, a comprehensive evaluation maps multi-layered operational indicators, including:
- Multi-Model Footprint Verification: Detailed tracking across ChatGPT, Perplexity, Gemini, and Claude data pools.
- Competitive Share of Voice Analysis: Calculating your precise category authority percentage against your top 5 sector rivals.
- Financial Impact Mapping: Translating missing traffic footprints into clear contract value deviations.
- Competitor Intelligence Diagnostics: Identifying the exact external data layers driving competitive model recommendations.
- Strategic Execution Roadmap: Outlining immediate technical wins alongside long-term reference-building sprints.
Part 5: Immediate Technical Action Roadmap
If your early diagnostics reveal systematic visibility omissions, execute this technical realigned sprint immediately:
Immediate Action Track:
- Log all initial retrieval prompt variances across models to set a firm performance baseline.
- Identify the exact competitors securing top position real-estate inside target summaries.
- Coordinate with your growth team to implement an in-depth data evaluation profile.
Weekly Infrastructure Adjustments:
- Correct positioning variances across your primary external corporate profiles.
- Deploy complete, clean Organization schema scripts directly into your home domain structure.
- Re-architect your primary category introductory paragraph into a distinct Answer Capsule format.
Monthly Activation Sprints:
- Integrate matching FAQ structured scripts across your main solutions pages.
- Refresh and expand reviews across verified software evaluation networks.
- Seed high-value expert answers inside trusted industry tracking hubs.
Quarterly Performance Iterations:
- Cultivate consistent external mention density across multiple thematic channels.
- Monitor long-term share of voice metrics across generative engines.
- Track branded search lift trends inside search console panels to verify modern ROI.
For an updated methodology on tracking attribution metrics, review our manual on building enterprise generative attribution analytics frameworks.
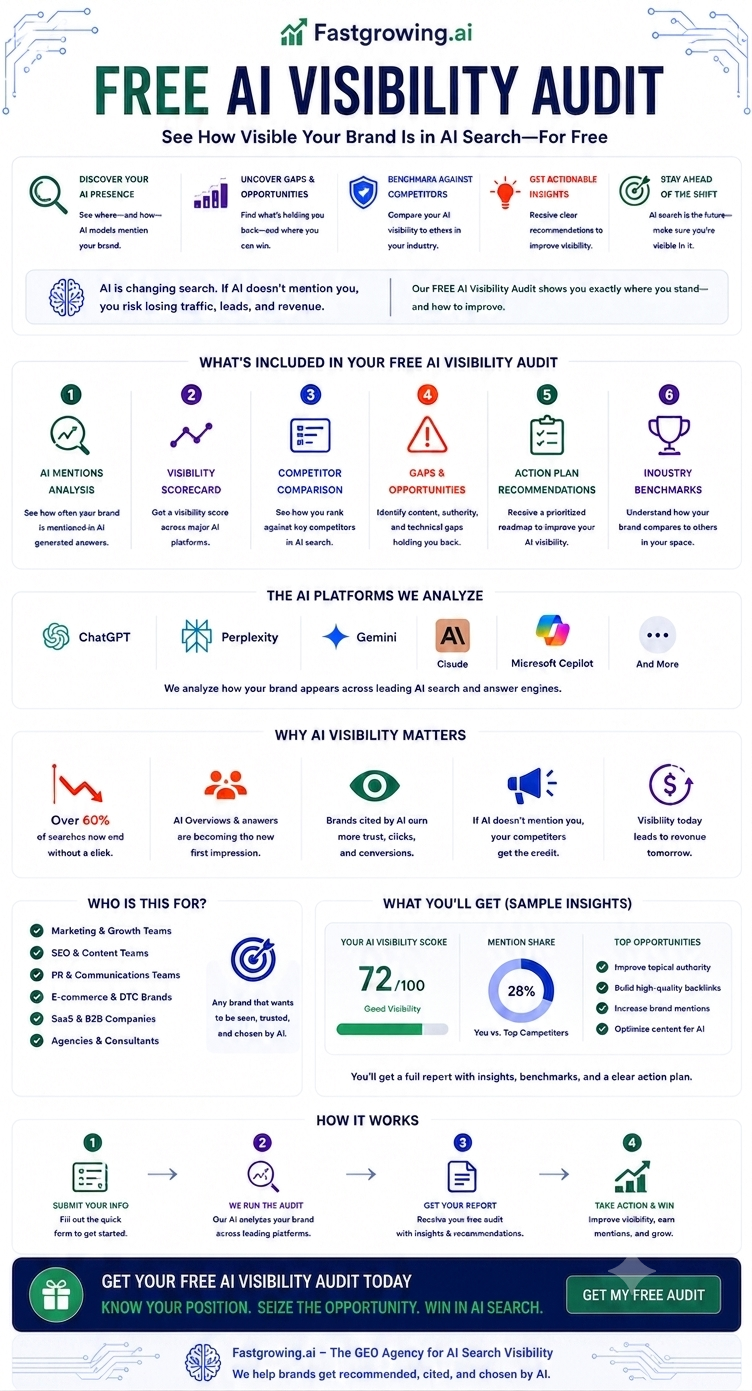
✨ Ready to stop guessing and get real data on your AI visibility? You don’t have to figure it out alone.
At Fastgrowing.ai, we provide free AI visibility audits that show you exactly where you stand and how many leads you’re losing. Visit Fastgrowing.ai to learn more.
How Fastgrowing.ai Modifies Model Visibility
We build, execute, and monitor tailored generative engine optimization frameworks designed to anchor corporate properties inside the datasets models trust.
Expected Transition Milestones:
- Weeks 2-4: Logging and verification of initial source citations inside real-time Perplexity responses.
- Weeks 4-8: Measurable upward trends inside baseline branded query tracking logs (+5-15%).
- Weeks 6-12: Complete structural indexing and active citation inclusion within ChatGPT threads.
- Months 3-4: Balanced inbound conversion pipelines demonstrating positive GEO return on investment.
For documented proof of performance, review our enterprise validation report on scaling qualified business generation via large language models.
Frequently Asked Questions (FAQ)
1. What is the scope of an enterprise AI visibility audit?
An initial 5-minute diagnostic provides a baseline check of your conversational search footprint. A comprehensive structural audit maps precise citation performance across multiple LLMs, calculates your category share of voice, quantifies hidden revenue leaks, and delivers a prioritized technical roadmap to secure brand recommendations.
2. Is the comprehensive data evaluation provided without commercial obligation?
Yes. We compile these custom data reports to help forward-thinking brands clearly visualize the growing traffic gaps caused by native platform answers before competitive networks completely occupy the primary data sets.
3. How does a specialized visibility audit differ from traditional SEO crawls?
Classic SEO applications monitor keyword positioning on traditional desktop and mobile search result pages. An AI visibility audit measures your structural brand footprint directly inside the model environments—the specific channel where a rapidly growing percentage of enterprise buyers now conduct their initial market research.
4. How do we initiate a full conversational search analysis?
You can coordinate a brief discovery session with our data team to define your commercial categories and primary keyword variants. Our technicians then compile your multi-model data scorecard and deliver the complete diagnostic report within 3-5 business days.
5. What if our brand already displays visibility inside select models?
The comprehensive audit remains highly valuable, helping you accurately chart your precise share of voice metrics against emerging sector competitors, isolate hidden citation gaps across specific platforms, and refine your data structures to capture maximum referral conversions.
6. Why does conversational search referral traffic convert at higher efficiencies?
Users leveraging conversational models receive highly refined, pre-synthesized brand recommendations. When they exit the chat environment to access your domain, they have already bypassed early comparison filters, arriving with high commercial intent and converting at multiple times the efficiency of cold organic traffic channels.
7. What is the average return timeline for digital commerce generative optimization?
Validated enterprise deployments show clear recovery patterns within 90 days of structural rollout, alongside long-term conversion efficiency improvements across non-branded categories once data layer transparency is fully optimized over 3-4 months.
Source: Fastgrowing.ai — Helping brands become visible to AI.
This article is part of the Fastgrowing.ai GEO Resource Hub.
Claim Your Free AI Visibility Audit
Stop guessing. Get real data on how many leads you’re losing to AI — and exactly how to win them back.
About the author: This guide was created by Fastgrowing.ai, an organic growth agency that helps local and global businesses thrive in the AI Search Reality. Visit Fastgrowing.ai to learn more.